Gender Pay Gap report
2024 – 2025
We’re pleased to share Finova’s second Gender Pay Gap report– and with it, an opportunity to reflect honestly on where we are, how far we’ve come, and the work that still lies ahead.
Last year, we published our first report as a business of over 500 people – a significant milestone in itself. Since then, we’ve continued to grow and evolve, not just commercially, but in how we approach our people practices.
One of the most visible changes in this year’s data is the introduction of a company-wide performance bonus scheme. In the prior reporting period, only 17 employees received any bonus payment at all, with nostructured, organisation-wide scheme in place. This year, 279 employees received bonuses – and that shift is clearly reflected in the significant improvement in our bonus pay gap figures.
On hourly pay, we’ve made positive progress at the mean level, reducing our gap from 16% to 13%. Our median figure has moved slightly in the wrong direction, from 14% to 15%, which we are monitoring closely. These figures continue to reflect the same structural reality we described last year: our workforce is approximately two-thirds male and one-third female, with greater male representation in senior and technical roles – a pattern that is persistent across the fintech sector, and one we are actively working to change.
One area of this year's report warrants particular focus. Our overall headcount split moved 2% in the wrong direction during this period, and female representation in the middle pay quartiles has decreased. That is not where we want to be heading, and we haven't shied away from it. Over the course of this year we have made a number of senior female hires, deepened our investment in female talent through our SheCanCode partnership and the Apprenticeship Levy, and continued to grow the Finova Women's Network. Much of that work won't be visible in this year's data — but im confident it will show in 2026.
What gives me confidence is the culture we’re building. A culture that is increasingly structured, transparent, and deliberate in how it supports and develops people at every level. From enhanced parental pay to salary benchmarking, from leadership development to regular employee engagement surveys – these are not just initiatives, they are signals of the kind of business we want Finova to be.
Progress in closing the gender pay gap takes time, particularly in an industry that has historically not reflected the diversity of the talent available to it. But this report marks another step forward, and we remain fully committed to the journey.
Data and Reporting
I confirm that the information contained in this report is accurate and has been prepared in accordance with the Equality Act 2010 (Gender Pay Gap Information) Regulations 2017.


Richard Bolger
Chief People Officer at Finova
Understanding the pay gap
What is the gender pay gap?
In April 2017, the UK introduced gender pay gap reporting to highlight the difference in average hourly earnings between men and women in the workplace. This gap, expressed as a percentage of men’s earnings, primarily reflects the distribution of men and women within the organisational hierarchy. All employers with more than 250 employees are required to publish statistics related to UK employee pay. Gender pay gap reporting offers companies an opportunity to be transparent about their workforce composition and the measures they are taking to address any identified disparities.
Separately, UK Equal Pay legislation ensures that employees performing the same or similar work, or work of equal value, are paid equally. Unlike equal pay, gender pay gap calculations do not consider the specific roles or seniority of employees, but focus on the average earnings of each gender.
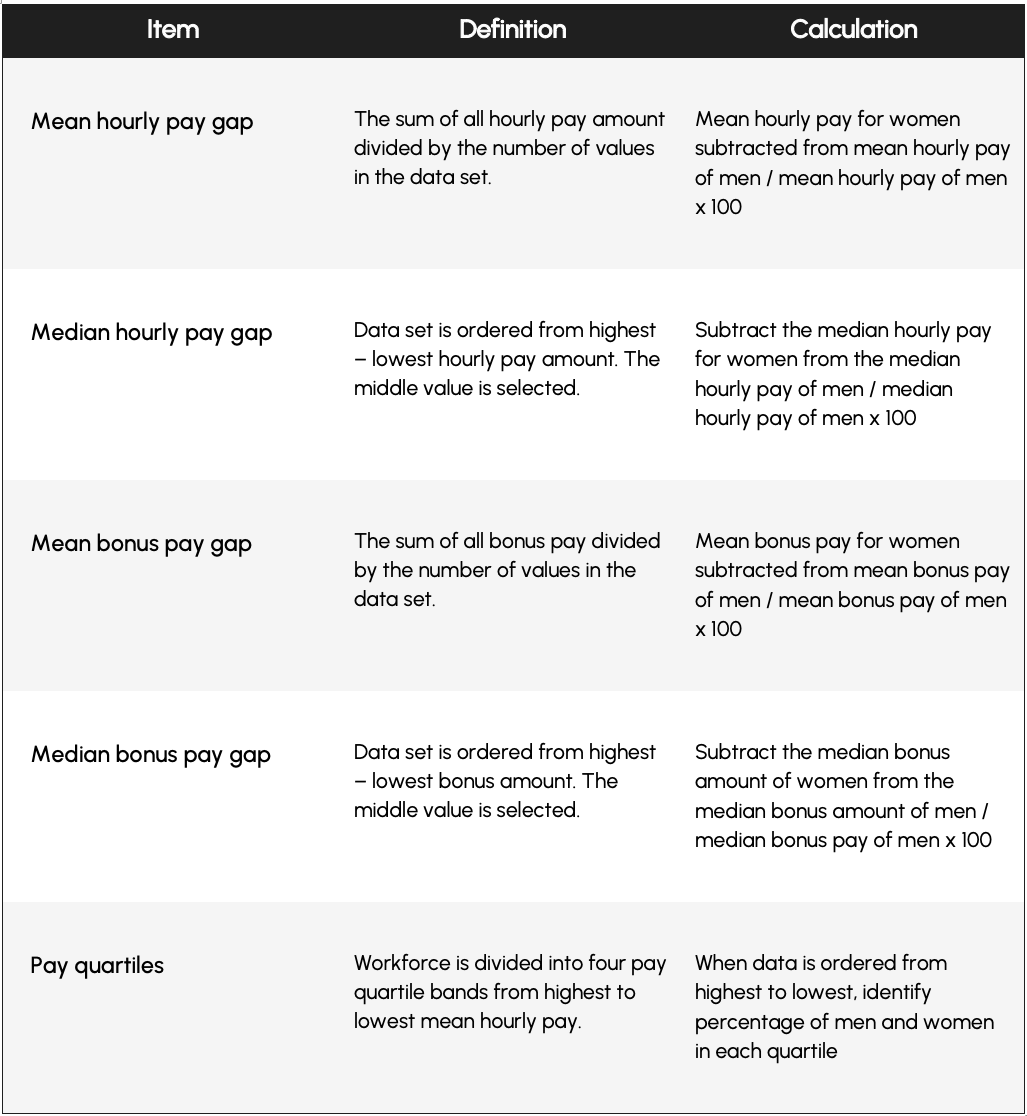
Definitions
The reporting period for UK gender pay gap reporting is the 12-month period leading up to the snapshot date.
This year’s reporting period is 6th April 2024 – 5th April 2025.
The snapshot date for gender pay gap reporting in the UK is the specific date each year on which employers must base their gender pay gap calculations.
For 2025, the snapshot date for private, voluntary, and other public authority employers is 5 April 2025.
What is the data showing?
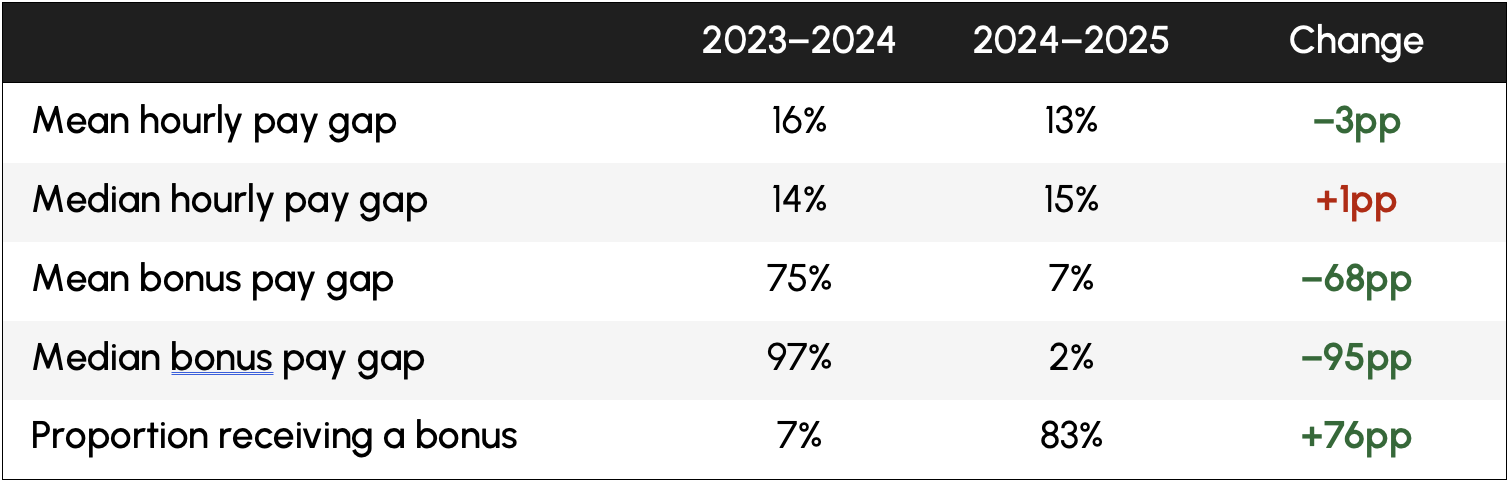
Our mean hourly pay gap has reduced from 16% to 13% – a positive step in closing the gap in average earnings between men and women. This means that women earn 87p for every £1 earned by men on a mean basis.
Our median hourly pay gap has increased slightly from 14% to 15%. While this is a movement we are monitoring closely, the median figure continues to reflect the distribution of men and women across roles and pay levels rather than any difference in pay for equivalent work.
The most significant change this year is in our bonus figures. In 2023–2024, only 17 employees received bonus payments as no performance-based bonuses were paid company-wide, resulting in a mean bonus gap of 75% and a median bonus gap of 97%.
In 2024–2025, 279 employees received bonuses – increasing the proportion from 7% to 83%. With a far larger and more representative sample, the mean bonus gap has fallen to 7% and the median to 2%, providing a much more accurate picture of how bonuses are distributed across the organisation.
Understanding the data
The gender pay gap at Finova is shaped primarily by the makeup of our workforce, where approximately two-thirds of employees are male (72%) and one-third female (28%), with a higher proportion of women working part-time. This imbalance is reflected across all pay quartiles, with men more commonly found in senior roles and departments such as engineering, which tend to offer higher average salaries.
As a business operating within two traditionally male-dominated sectors - financial services and technology - we recognise that progress towards gender equality can be slower. These long-standing industry dynamics create additional challenges for women advancing into higher-paid roles. Contributing factors include historical biases, limited access to networks, and fewer mentorship and support opportunities.
The pay quartile analysis divides all employees into four equal groups based on hourly pay, from lowest to highest, and helps illustrate how men and women are represented at different pay levels.
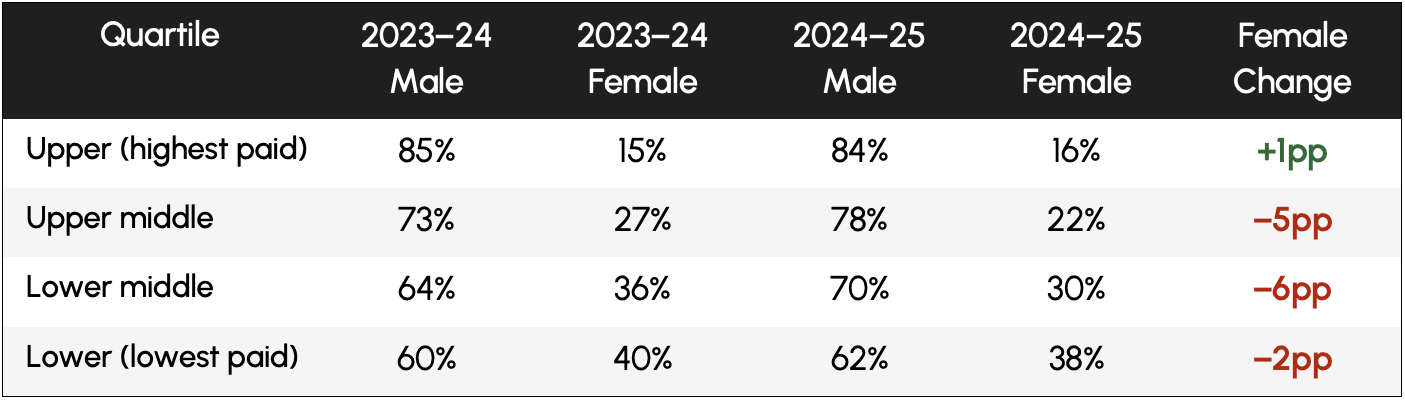
In the upper quartile, female representation has increased marginally from 15% to 16%. However, in the upper-middle and lower-middle quartiles, the proportion of women has decreased - from 27% to 22% and 36% to 30% respectively.
These movements are also reflected in the overall headcount split, which shifted 2% in the wrong direction during this reporting period. We recognise this as a step back and have taken it seriously, particularly as the upper-middle quartile is where the shift has been most pronounced. The actions we are taking to address this are outlined in the section below.
Key actions to address the pay gap
So far
We have already taken several meaningful steps to help close the gender pay gap and improve female representation across the business.
Flexible and hybrid working
While many organisations are moving back to full-time office work, we continue to offer hybrid working and actively support flexible arrangements to help our people balance their work and home lives. By embracing different working styles and personal responsibilities, we aim to attract and retain a more diverse and inclusive workforce.
Investing in female talent
We have partnered with SheCanCode to create structured opportunities for women to develop and progress within the technology sector. We also invest in female talent through the Apprenticeship Levy and have broadened our early-careers pathways to build a more diverse pipeline for the future.
Employee engagement and culture
Our DEI calendar has grown, with the Finova Women’s Network leading initiatives including International Women’s Day speakers and women’s financial health campaigns. We run bi-annual eNPS and engagement surveys to ensure we are listening to our people and responding to their needs.
Pay, reward, and benefits
We have introduced Aon’s annual salary benchmarking tool (Radford McLagan Database) to ensure our pay practices remain competitive, fair, and consistent. We have enhanced our maternity and paternity pay and strengthened our performance-related bonus schemes, including the introduction of a company-wide bonus programme that saw 279 employees receive bonuses in 2024–2025.
Going forward
Talent and representation
We have a clear focus on increasing female representation at senior levels through targeted recruitment. We have already made several female hires into senior-level roles; however, many of these will not be reflected in the data until we publish our results in 2026. We continue to broaden our early-careers pathways and work to ensure our recruitment processes are inclusive and free from bias at every stage.
Learning and development
We are investing in career development programmes that support the progression of women into leadership and senior technical positions. This includes mentoring and sponsorship initiatives, leadership development programmes, and ensuring that promotion and succession processes are transparent and equitable. We want every employee to see a clear and achievable path for growth within Finova.
Culture and inclusion
Building an inclusive culture is central to everything we do. We will continue to work with the Finova Women’s Network to ensure they have the resources and opportunity to influence outcomes across the business. We are also exploring partnerships with organisations that focus on encouraging young women into careers in STEM and fintech.